
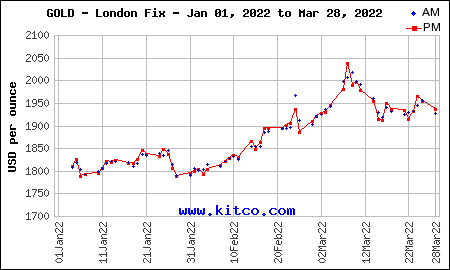
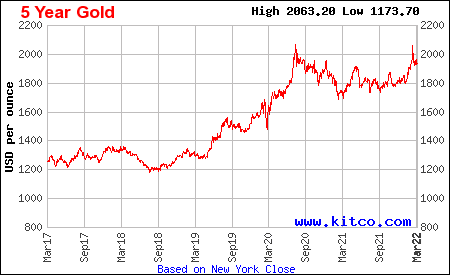
The price of gold rose dramatically, as the invasion caused serious worldwide concern, gold became a safe haven (risk-on) for investors and countries (Figure 1). Russia’s invasion of the Ukraine has been one of the biggest geo-political risks since World War II. The price of gold achieved a new high of US$2,039 in March 2022.
Recent peace talks between Russia and the Ukraine caused a slight reversal in the risk-on trade of buying gold but where could the price ultimately end up? For the moment, there is no resolution, so it is worthwhile to review the history of past conflicts and economic uncertainty to see if there is a possible conclusion as to what direction the gold price is heading.
Figure 1
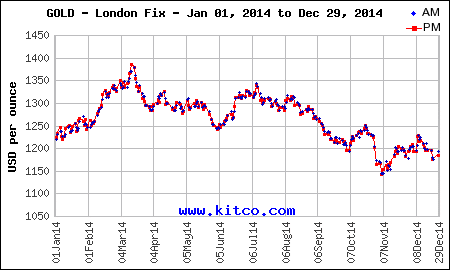
It is not the first time Russia has invaded the Ukraine, so it is worth a review of what happened to the gold price in the previous situation. The revolution of Dignity also known as the Maidan Revolution was a result of large-scale protests against the Ukrainian President Viktor Yanukovych’s decision not to join the EU and instead forge closer ties with Russia. Ultimately, the president and the Ukrainian government were overthrown. The capital of Kyiv came under control of the protesters and an interim government was formed. The overthrown president asked Russia to intervene which resulted in the annexation of Crimea and started the Donbas War.
The gold chart for the year of 2014 showed a rise in the gold price as the conflict escalated (Figure 2) and subsequently fell to a level which was lower than the start of the year as a ceasefire (Minsk Protocol) was signed in September 2014. The current situation with Russia is under different circumstances so we cannot assume a resolution will lead to a weakness in the gold price.
Figure 2
The financial crisis was one of the worst since the Great Depression. The US gross domestic product fell 4.3% from peak to trough, the unemployment rate more than doubled from less than 5% to 10%. The first indication that the US economy was not all that it seemed, was when Lehman Brothers on September 15, 2008, declared bankruptcy. The following day the US government announced the bailout of AIG Insurance to the tune of US$85 billion. In December 2008, the Case-Shiller home price index reported its largest drop in history. The burst of the housing bubble was the main cause of the crisis at this time, it had a knock-on effect causing massive mortgage defaults by consumers which in turn caused lending institutions to go into bankruptcy. There was also a massive decline in the value of mortgage-backed securities due to sub-prime lending. This led to an interbank credit freeze causing a lack of liquidity in the system, as banks did not want to provide loans. The crisis caused an upward trajectory in the gold price, where it achieved a new high of $1896.50 in 2011 (Figure 3). It could be said the bursting of the housing bubble created a bubble in the gold price, which deflated with a much less dramatic effect on the economy then the financial crisis.
Figure 3
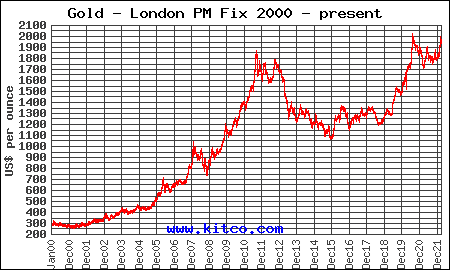
The increase in the price of gold was rooted in the world economic collapse of 2009. The peak in 2011 (Figure 3) was a result of quantitative easing by world central banks and unprecedently low global interest rates which meant real rates were negative so holding cash in the bank resulted in the loss of purchasing power, a negative return. In addition to the economic uncertainty, there was unrest in the Middle East causing concerns the price of oil would rise. There was the Fukushima nuclear disaster in Japan in March 2011, caused by a Tsunami which rattled the markets and questioned Japan’s ability to recover from the disaster.
In Q1 of 2013 the start of the decline in the gold price was triggered by Cyprus, suggesting it would sell half a billion of its gold reserves to fulfil its €10 billion EU/IMF bailout. By the end of 2013 the Cyprus central bank said it would not sell its gold reserves to cover the bailout.
Another contributor was the announced reduction in Quantitative Easing (QE) also known as Fed Tapering, where governments reduce buying bonds from financial companies and pension funds to lower interest rates for consumers and businesses, this meant a slight rise in interest rates but at this time inflation was not a factor which is an important consideration when looking at real versus nominal interest rates to be addressed later.
QE is still in use today by many governments due to the Covid situation. The US Federal Reserve has doubled its balance sheet of long term-securities since the start of the pandemic from $4.31 trillion to $8.87 trillion. This injects more fiat money into the system which gold bugs say justifies a doubling in the gold price from its current level. If it were only that simple.
The Corona Virus or COVID 19 is a pandemic not seen since the Spanish Flu in 1918. The world was not prepared to deal with the pressures on the human population and healthcare which initially resulted in a lot of confusion and chaos. It was unknown as to what the worldwide effects would be. The decision to shut down social venues and workplaces from March 2020 to the end of 2021, negatively affected global economies. The five-year gold chart below (Figure 4) reveals gold was range bound between $1200-$1300 in the two years prior to the pandemic. As the pandemic continued the gold price progressed forward to a new all-time high of $2074.88, thanks in part to QE. As restrictions were lifted the gold price moved to a low of $1683.95 in March of 2021. The pandemic has not ended so it is unknown as to what the future holds for the gold price in relation to the pandemic.
Figure 4
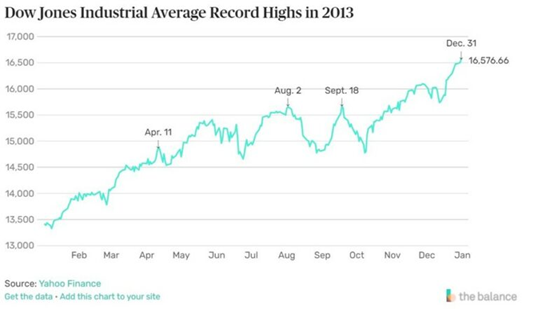
By the end of 2013 the Dow Jones Index reached a record high and had increased 26% over the year, (Figure 5) making equities more attractive to investors than gold. After the 2008-2009 financial crisis, investors were feeling more confident about the economy as quantitative easing pumped a lot of liquidity into the system. As an example, one could borrow at low rates and invest in the market to achieve higher returns than the rate of borrowing. Could this be another bubble as interest rates rise, only time will tell.
Figure 5
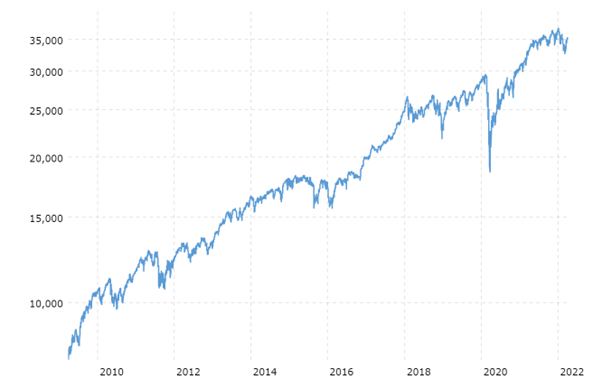
The trajectory of the Dow Jones Index has continued since 2013 (Figure 6) which contributed to the decline in the gold price from that time (Figure 3) until the start of the pandemic in 2019, where there was a pull-back in stocks due to the uncertainty surrounding COVID. Rising equities was not the only contributing factor to the decline in the gold price but it was influential.
Figure 6
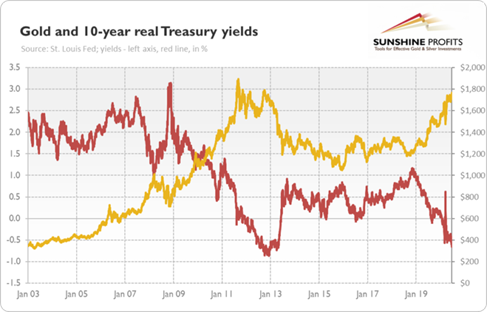
Another major contributor to the movement in gold prices is the yield on the 10-year US Treasury bond. Gold is not affected by interest rates but the real interest rate, which is the difference between nominal interest rate and the actual or expected inflation rate. Gold is negatively correlated to the inflation adjusted 10-year US treasury yield (10-year constant maturity rate minus 10-year expected inflation rate) as is evidenced in the chart (Figure 7). When the 10-year bond yield fell dramatically in 2009 due to the economic crisis and the reaction by governments to stimulate the economy through quantitative easing and low interest rates, the gold price accelerated. As the 10-year bond yield started to rise in 2013 the price of gold declined. In 2019 due to the global pandemic, governments reinstated economic stimulus measures, such as quantitative easing which caused yields to drop in line with interest rates and the gold price started to rise.
10-year bond yields are on the rise in 2022 due to inflation pressures caused by sanctions instituted by certain countries on Russia. The sanctions in Russia have caused a rise in commodity prices and supply challenges which have contributed to an increase in global inflation. Central banks have reacted with an increase in interest rates as a counterbalance to inflation. In this case a rise in inflation could result in support of the gold price. Something to consider: The low price of gold in 2003 is indicative of a low inflation rate of 2.28% in the U.S. the 2022 rate of inflation in the U.S. is 7.9% a new 40 year high.
Figure 7
Due to the current geo-political tensions affecting the gold price caused by Russia, it is worth noting the country’s foreign reserves and gold holdings. Near the end of March 2022 Russia’s central bank set a fixed rate for buying gold from local banks. One can only conclude that Russia is looking to back their currency by gold which could make the Ruble more stable and stronger. Below see the top 10 countries with the highest gold reserves (Figure 8). Russia is fifth on the list and holds over 5000 tonnes less than the US, therefore they have a lot of gold to buy if they want to surpass the US in terms of holdings. Interesting to note that gold only makes up 22% of their foreign reserves.
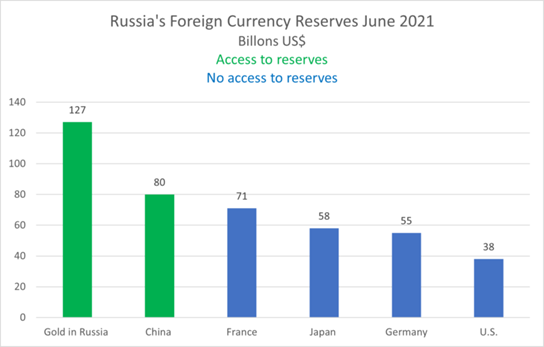
Due to sanctions against Russia the country does not have access to their money held in overseas banks, this may change their future foreign reserve strategy to hold more gold bullion within Russia, their buying would add support to the gold price. Other countries who could be subject to sanctions may look at what has occurred with Russia and increase their gold holdings as well. It is also worth looking at the top six countries where Russia has allocated their foreign reserves and their ability to access them due to sanctions (Figure 9).
Figure 8

Figure 9
A dramatic rise in the gold price happens during geo-political and economic uncertainty. A slow steady rise in the gold is price is preferable as it would occur in an environment which is globally geo-politically and economically more stable.
Investing in gold is not for the expectation of double digit returns year over year. From January 4, 2011 to January 4th 2022 holding gold would have returned 39.94% for an annual return of 3.99%. The yield on the US 10-year treasury bond as of March 30, 2022, is 2.35%. An investor could potentially achieve a triple digit return on a gold exploration company when it has made a discovery, albeit at higher risk. Gold mining companies are making good profits at the current gold price and would continue to do so at a $1300 gold price. Investing in a gold mining company could offer higher returns then bonds and bullion with some risk but less so then an exploration company but at the forfeit of triple digit returns.
The purpose of holding gold as part of an investment portfolio, is to maintain purchasing power in times of inflation or devaluation of a currency. Review the previous comment of the low gold price, 2003 gold price of $363.83 is indicative of a low inflation rate of 2.28% in the U.S. the 2022 rate of inflation in the U.S. is 7.9% a new 40 year high. This rate of inflation is indicative of most countries if not higher.
When Russia invaded Ukraine, the Russian Ruble declined dramatically against the US dollar and other currencies. Russians flocked to buy bullion and coins to protect their savings as the Ruble collapsed; this shows the perception of gold when the fiat money of a country goes into free fall. It solidifies gold’s position as a counterbalance to legal tender issued by a country, that is not backed by anything of value except the government.
Bonnie Hughes
Freelance Writer